We can basically divide the implementation diagram into:
- Package diagram.
- Component diagrams.
- Deployment diagrams.
All of them will serve to specify in some way how the implementation of the result of the domain analysis we are dealing with should be carried out.
The component diagram forms part, together with the package diagram, of the implementation view.
Component diagrams represent the dependencies between various physical components of the system. They show the organization (containment of ones within others) and the dependencies between software components.
A component represents a source file, a library, or an executable. Components are artifacts (manufactured elements) that form part of the system's implementation. A component is graphically represented as a rectangle with a small ellipse and two small rectangles protruding from the side.
Normally, software components are considered at three levels:
- Source code.
- Libraries.
- Executables.
The source code level shows compilation dependencies between files.
In C++, these would be include dependencies, for example.
In C#, these would be using dependencies.
In Java, these would be import dependencies.
Each class in the logical model can be realized in the source code component diagram in two components: the specification and the body. In C++, for example, a specification corresponds to a file with an .hxx suffix and a body corresponds to a file with a .cxx suffix.
The runtime level shows the mapping of classes to libraries at runtime.
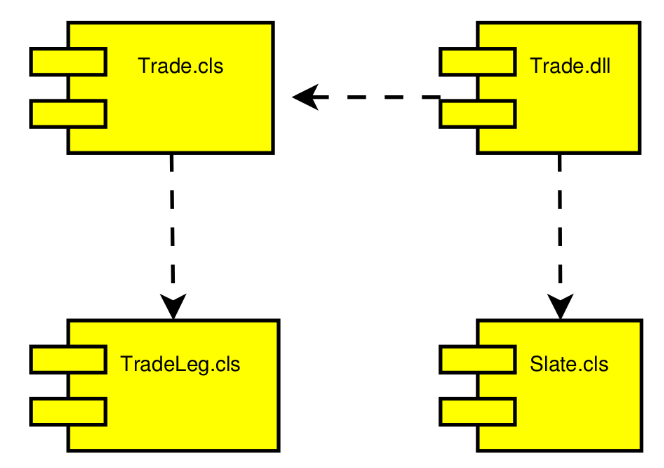
The following figure illustrates that the Trade library (Trade.dll) depends on the Slate class (Slate.cls) and the Trade class (Trade.cls).

The executable level shows the interfaces and call dependencies between executable programs.

This figure shows that the Trade executable communicates with the Contracts executable through the TradeContract interface. It also communicates with the Trade library through the TRade interface.
Deployment diagrams show the system configuration at runtime by illustrating how various processes are distributed across processors, computers, or other different devices.
The deployment view shows the configuration of processing nodes at runtime and the components, processes, and objects that live inside them.

The deployment diagram basically contains:
- Nodes: A runtime object representing a computational resource (which generally has at least memory, and often processing capacity). Stereotypes allow specifying the nature of the equipment, devices, processors, memory...
- Connections: Shows the communication path between several nodes. The association can have a stereotype indicating the nature of the communication (such as the type of channel or network).

- The runtime environment of a company providing internet services consists of three servers and two clients. Business logic server 1 contains a component called Jar1 that contains the business logic of a web application. Business logic server 2 contains the same component, and the third server, responsible for the web layer, is named web application server and contains component War1. This component uses the InterfícieJar1 interface implemented by Jar1 in the two servers containing the component. Web clients contain a browser and use the InterfícieWar1 interface of component War1. The "rich client" client has a ClientJar1 component that uses the interface of module Jar1 on business logic server 1 through its interface. a) What type of UML diagram would you use to represent this situation?
Deployment diagram.
b) Draw it.
