Introduction
An interaction is the specification of the behavior of a use case or an operation in terms of a sequence of messages between objects. These messages contain stimuli that can be requests to execute operations or signals. A sequence of images is called a thread of execution.
Collaborations
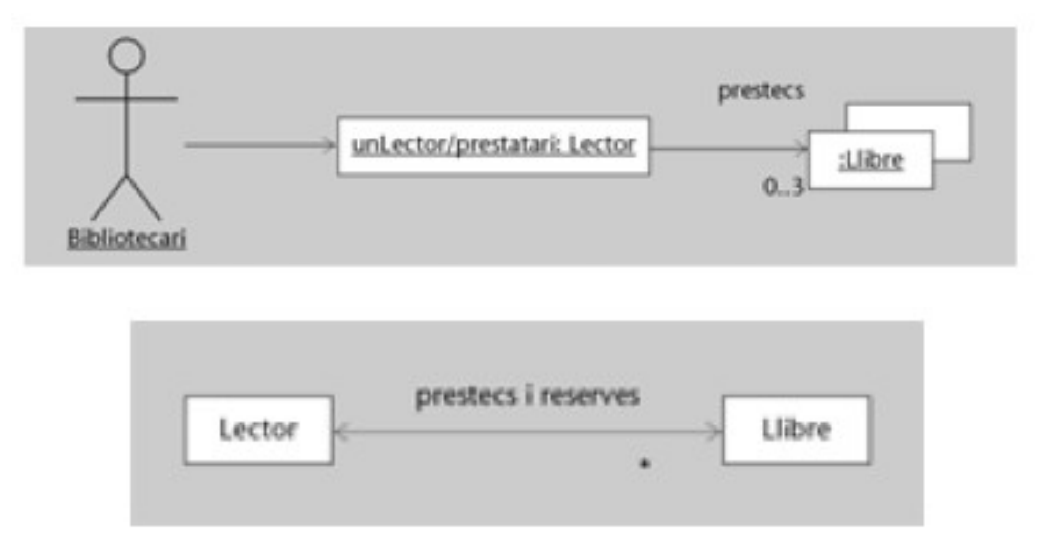
A collaboration is a set of roles, classifiers, or instances, and association roles between the objects involved in an interaction. Collaborations are used for consistency between the classes and associations defined in the static model and the associations and objects defined in the use case. Collaborations can be defined from classifiers or instances.
Sometimes we will be interested in representing multiobjects, which represent a set of objects of a role with a multiplicity greater than 1 within an association.

UML offers 3 diagrams to represent interactions and collaborations:
- The communication diagram, which places emphasis on the description of the collaboration.
- The sequence diagram, which places emphasis on the time sequence of messages in an interaction.
- The activity diagram, which serves to describe the state of an activity.
Communication diagram
The collaboration diagram is the representation of an interaction.
It starts from the static diagram, on which the messages of the interaction are represented.
Each message has the following specification:
PREDECESSORS GUARD SEQUENCE_EXPRESSIONS RETURN_VALUES SIGNATURE
PREDECESSORS: List of predecessor messages '('SEQ_NUM, SEQ_NUM ')'
GUARD: Condition that must be met for the message to be sent.
SEQUENCE_EXPRESSIONS: Seq_num '['RECURRENCE''],...,':'
RECURRENCE: '*' '['ITERATION_CLAUSE']'
RETURN_VALUES: Return values as a result of the process triggered by the message RETURN_VALUES ',' RETURN_VALUES ... ':='
SIGNATURE: Stimulus name and list of arguments.
Object creation (new), destruction (destroyed), and links (transient) can also be indicated.
Simple messages: correspond to a simple execution within a thread of execution.

Asynchronous messages: these messages occur when the client sends a message to the provider and the latter accepts the message. The emitting class waits to receive the result of the operation associated with the message.

Asynchronous messages: in this case, the sending class sends a message to the provider and continues executing without waiting for the result to arrive from the receiving class. In these cases, the receiving class will usually queue the execution of the received request.
Response message:
<- - - - - - - - - - - - -

Sequence diagrams
Unlike collaboration diagrams, sequence diagrams do not explicitly represent the role of associations. On the other hand, they do represent the passage of time and the duration of messages.
Time is represented downwards and is not necessarily to scale.
Horizontally, and in successive bands, the different roles of the classifiers participating in the interaction are represented.
Messages flow from left to right, and responses the opposite way.
An element symbolizing the existence of the role over a certain period of time is called a lifeline. It is represented by a vertical dashed line extending from the creation to the destruction of the object.
To represent the destruction of an object, an "x" is placed at the end of the lifeline.
During the life of an object, there may be several constructors depending on the conditions emitted by the message.
An activation is a portion of the lifeline during which a particular role executes an action or other roles execute other actions as a result of an action executed by the first one.
Activations coincide with sending a message and receiving a response.
If you make self-calls, these are represented with another slightly offset box.
Messages can be of the same type as in collaboration diagrams, and arrows are represented the same way.
The order of execution is represented from top to bottom over time.
Sequence numbers are not identified because they are implicit.
Two arrows can originate from the same activation point if two messages are sent at the same time.
Return messages are represented with a dashed line.

Concretions and examples:
Use case diagrams present an external view of the system. Interaction diagrams, which include sequence diagrams, describe how use cases are realized (made a reality) as an interaction between sets of objects.

Sequence diagrams show the flow of messages (events) between various instances over time. In fact, they offer a formal way to specify a scenario.
The order in which messages are sent can be seen immediately because time is an explicit dimension of the diagram (vertical axis).
Each instance is represented by a different vertical path.
It is a graphical view of a scenario (a concrete path of a use case diagram) illustrating interactions between objects as a time sequence. In fact, it can be created from the use case being described.

Actors and objects: these are the elements that communicate. Since both objects and actors are instances, object notation is used with a colon and the underlined name.
Lifelines: these are lines that represent the life of objects (or actors) over time. Time goes from top to bottom. The line becomes thick when this object is executing an operation. We say that the object is active at that moment. Often, objects cease to exist. To indicate the point where an object is destroyed, a cross or "X" is placed at the end of the line.

Messages: represented by arrows pointing from sender to receiver and labeled with the message they send. Receiving a message causes the object to start its activity. The call return is indicated with a dashed arrow. It is only necessary to include it if we want to explicitly state what is returned. Otherwise, it can be assumed to return when the receiver's active zone ends.

Sequence diagrams allow the use of some control structures, which are great for simplifying them.
When we use control structures, we are not representing just a specific scenario, but rather generalizing.
Example of a message between two objects:

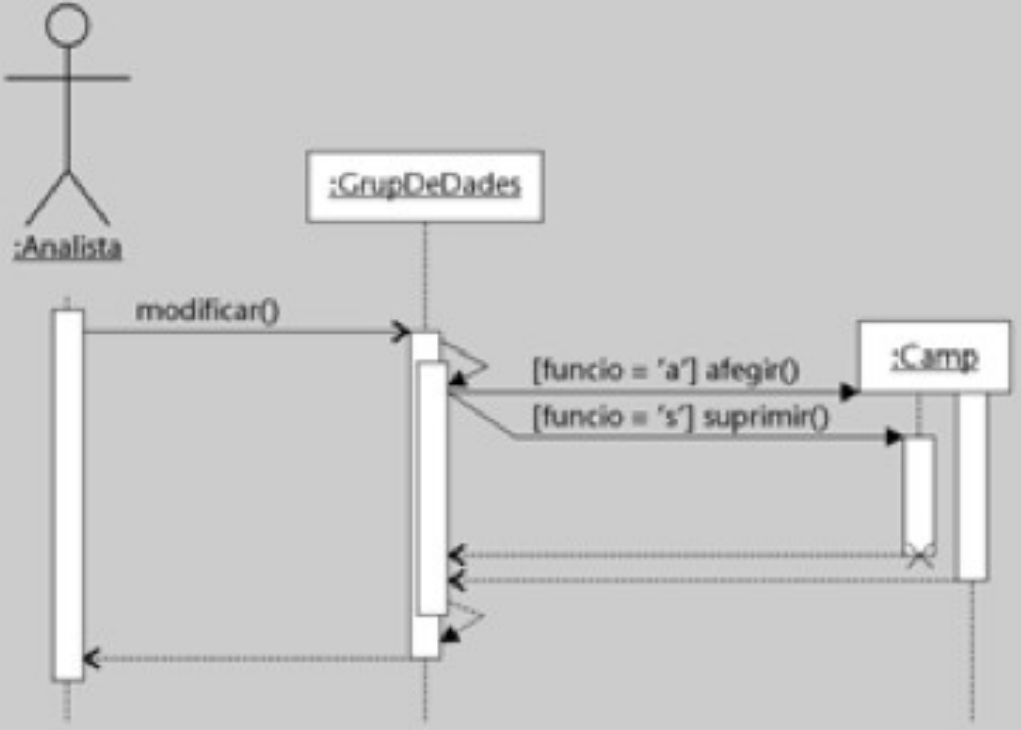
Example of conditional execution in a sequence diagram.

The diagram indicates two ways to express alternatives: one by making a part of the lifetime conditional, and another by conditioning the message sending with a guard.


If a message were needed for each object in the set, we could simplify the diagram by representing the set of objects with a multiobject, as shown in the figure above.
Sometimes an object can create or delete another object.
This can be represented as special messages.
A creation message does not point to an active region of the lifeline, but rather points to the object itself (it must be lower than the others).
The destruction message points to a cross at the end of the lifeline representing the end of the object's life.
Example of creation, destruction, and self-method calls.

Sequence vs. collaboration diagrams
The collaboration diagram is, like the sequence diagram, another realization of use cases. They are a combination of object and sequence diagrams. It shows the flow of events between objects.
Example of a collaboration diagram:
Remember that the collaboration diagram shows how objects work with one another by sending messages and exchanging data. Collaboration and sequence diagrams are two different views of interactions between objects. Both views represent exactly the same information.
The sequence diagram emphasizes the temporal view, but it is necessary to follow the diagram to know who relates to whom.
The collaboration diagram emphasizes the relationships established between objects, but it is necessary to follow the diagram to know the order of the messages.
Activity diagram
The activity diagram is a variation of the state diagram and interaction diagram because it serves to describe the state of an activity, which is the set of sequential or concurrent actions in which several classifiers can intervene.
These diagrams share many elements in common with collaboration and state diagrams. The concepts of transition, state, event, signal, control flow, and objects are the same.
The specific elements are:
- Action states.
- Object flows.
- Object flow states.
- Subactivity states.
- Swimlanes
- Control icons.
Activity diagrams are used to capture activity flows and decision sequences. They are ideal for representing internal behavior:
- of a method (the realization of an operation).
- of a use case.
- of a business process (workflow).
They can be understood as an extension of state diagrams, where each state is characterized by executing an activity, and where all transitions are automatic when the activity ends. However, it is enriched with other elements:
- Decision points: conditions that change the flow of actions.
- Concurrent execution paths.
- Signals, with explicit sending and receiving points.
- Objects affected by actions.
In UML 2.0 it is possible to represent conditions, synchronizations, signals, tokens...

Activities are linked by automatic transitions, passing through them from one activity to another.
When an activity ends, the transition to the next activity is triggered automatically.
Activities do not have internal transitions or event-triggered transitions. We could say that transitions are triggered automatically when an activity ends.
It is a variation of a state machine in which the states represent the execution of actions or subactivities, and transitions are triggered by the completion of actions or subactivities.
The activity diagram represents the state machine of a procedure.
Branches and merges:
A branch is a division of the activity flow into two alternative threads. Each time the diagram is executed, one or the other will be chosen depending on the condition.
The condition is specified as a guard on each outgoing connection.
A merge is the joining of two alternative threads into a single thread.
Branches and merges are represented with an empty diamond.

Forks and joins:
Synchronization bars allow, just like branches and merges, splitting the activity flow into multiple threads and then joining them again. The difference is that now they are not alternative threads, but concurrent threads. This means that both threads will always be executed and will always be executed at the same time.
We call the bar that separates the threads a fork bar, and the bar that joins the threads a join bar. It should be noted that the join bar has a consequence: if one thread arrives at the join point before the other, it will need to wait for the other to arrive, making it a synchronization point.

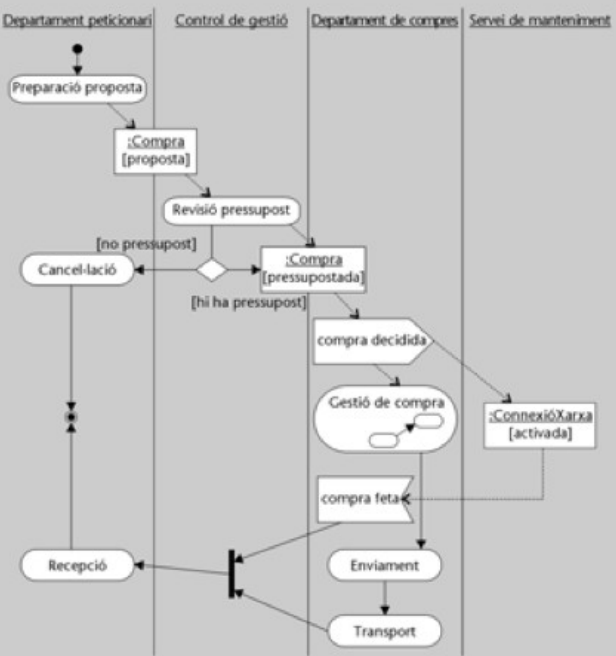
Lanes or swimlanes
Lanes serve to separate activities performed by different objects or actors. Thick lines divide the diagram into lanes. In each lane, we will place only the activities that the actor or object to which the lane belongs will perform.
Object flow: Inputs and outputs
Often, activities require the existence of objects, generate objects, or change their state. These objects can be added to the diagram using object diagram conventions. We can relate objects to activities using arrows that indicate the flow of the object.


- Based on the following sequence diagram, answer the questions:

a) What objects (name and classifier) are involved in the diagram?
Object: Q1:C1
- Name: Q1
- Classifier: C1
Object: Q2:C2
- Name: Q2
- Classifier: C2
Object: Q3:C3
- Name: Q3
- Classifier: C3
Object: :C4
- Name: None / Any
- Classifier: C4
b) Which objects are created and destroyed during the interaction?
Created: Q2:C2
Destroyed: Q3:C3
c) Draw the equivalent communication diagram.


a) What type of UML diagram is this?
Activity diagram.
b) According to what is represented in the diagram, if an error occurs in processing an order, what can the user do? What happens to the system?
The user cannot do anything.
c) Draw the state diagram of an order based on the information represented in it.
