Initial summary
The initial idea was to build a speedometer for a custom car company that was interested in upgrading its dashboard. The idea was developed using two ESP8266s with rotary potentiometers, simulating data from the car's CAN bus. Lacking immediate access to CAN bus simulation hardware, I redirected my project to develop a proof of concept for an IDE to design QML widgets in order to design new ones in a shorter timeframe.
Initial summary (Spanish)
The initial idea was to build a speedometer for a custom car company that was interested in upgrading its dashboard. The idea was developed using two ESP8266s with rotary potentiometers, simulating data from the car's CAN bus. Lacking immediate access to CAN bus simulation hardware, I redirected my project to develop a proof of concept for an IDE to design QML widgets in order to design new ones in a shorter timeframe.
Abstract
The initial idea was to make a speedometer to a car company that was interested in custom make an improvement to your dashboard. I developed the idea using two potentiometers connected to two ESP8266 for simulating data from the CAN bus of the car. Not having immediate access to hardware simulation of CAN bus, I redirect my project to develop a proof of concept of an IDE for designing widgets in QML to design new ones in a brief term.
You can check out the full project:
<figure class="gdoc-embed">
<iframe src="https://docs.google.com/presentation/d/1SZ9zNzEHZEvYmJciD1xcKc78t05h_-aXFZLDhRFCNkE/embed?start=false&loop=false" title="Presentació" loading="lazy" allowfullscreen></iframe>
<figcaption><a href="https://docs.google.com/presentation/d/1SZ9zNzEHZEvYmJciD1xcKc78t05h_-aXFZLDhRFCNkE/edit?usp=sharing" target="_blank" rel="noopener noreferrer">Presentació — abrir en Google</a></figcaption>
</figure>
<figure class="gdoc-embed">
<iframe src="https://docs.google.com/document/d/1Mo8lbrrXNGGUxM1vX9Jf4pxcPqneUuHzw8YmhHVb0pM/preview" title="2015PROJECTEFINALDAMMesasCervillaFrancisco" loading="lazy" allowfullscreen></iframe>
<figcaption><a href="https://docs.google.com/document/d/1Mo8lbrrXNGGUxM1vX9Jf4pxcPqneUuHzw8YmhHVb0pM/edit?usp=sharing" target="_blank" rel="noopener noreferrer">2015PROJECTEFINALDAMMesasCervillaFrancisco — abrir en Google</a></figcaption>
</figure>
<figure class="gdoc-embed">
<iframe src="https://docs.google.com/document/d/1G1Lo1tNInwLdM7d4haTAIGp6BaeeVCxN5SB1Yi0R7KA/preview" title="Manual usuari - ginys" loading="lazy" allowfullscreen></iframe>
<figcaption><a href="https://docs.google.com/document/d/1G1Lo1tNInwLdM7d4haTAIGp6BaeeVCxN5SB1Yi0R7KA/edit?usp=sharing" target="_blank" rel="noopener noreferrer">Manual usuari - ginys — abrir en Google</a></figcaption>
</figure>
<figure class="gdoc-embed">
<iframe src="https://docs.google.com/document/d/1AiqNJJR4604VRdAKsuvharkoCienYOn9OOO7It0Hugw/preview" title="Manual usuari - velocímetre" loading="lazy" allowfullscreen></iframe>
<figcaption><a href="https://docs.google.com/document/d/1AiqNJJR4604VRdAKsuvharkoCienYOn9OOO7It0Hugw/edit?usp=sharing" target="_blank" rel="noopener noreferrer">Manual usuari - velocímetre — abrir en Google</a></figcaption>
</figure>
System definition
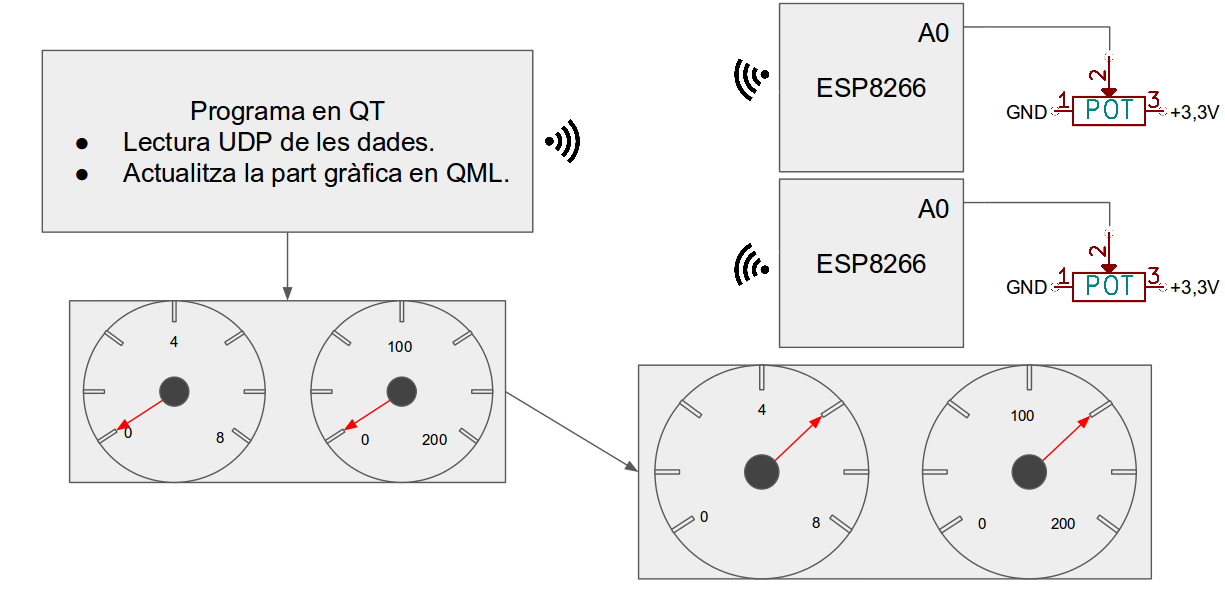
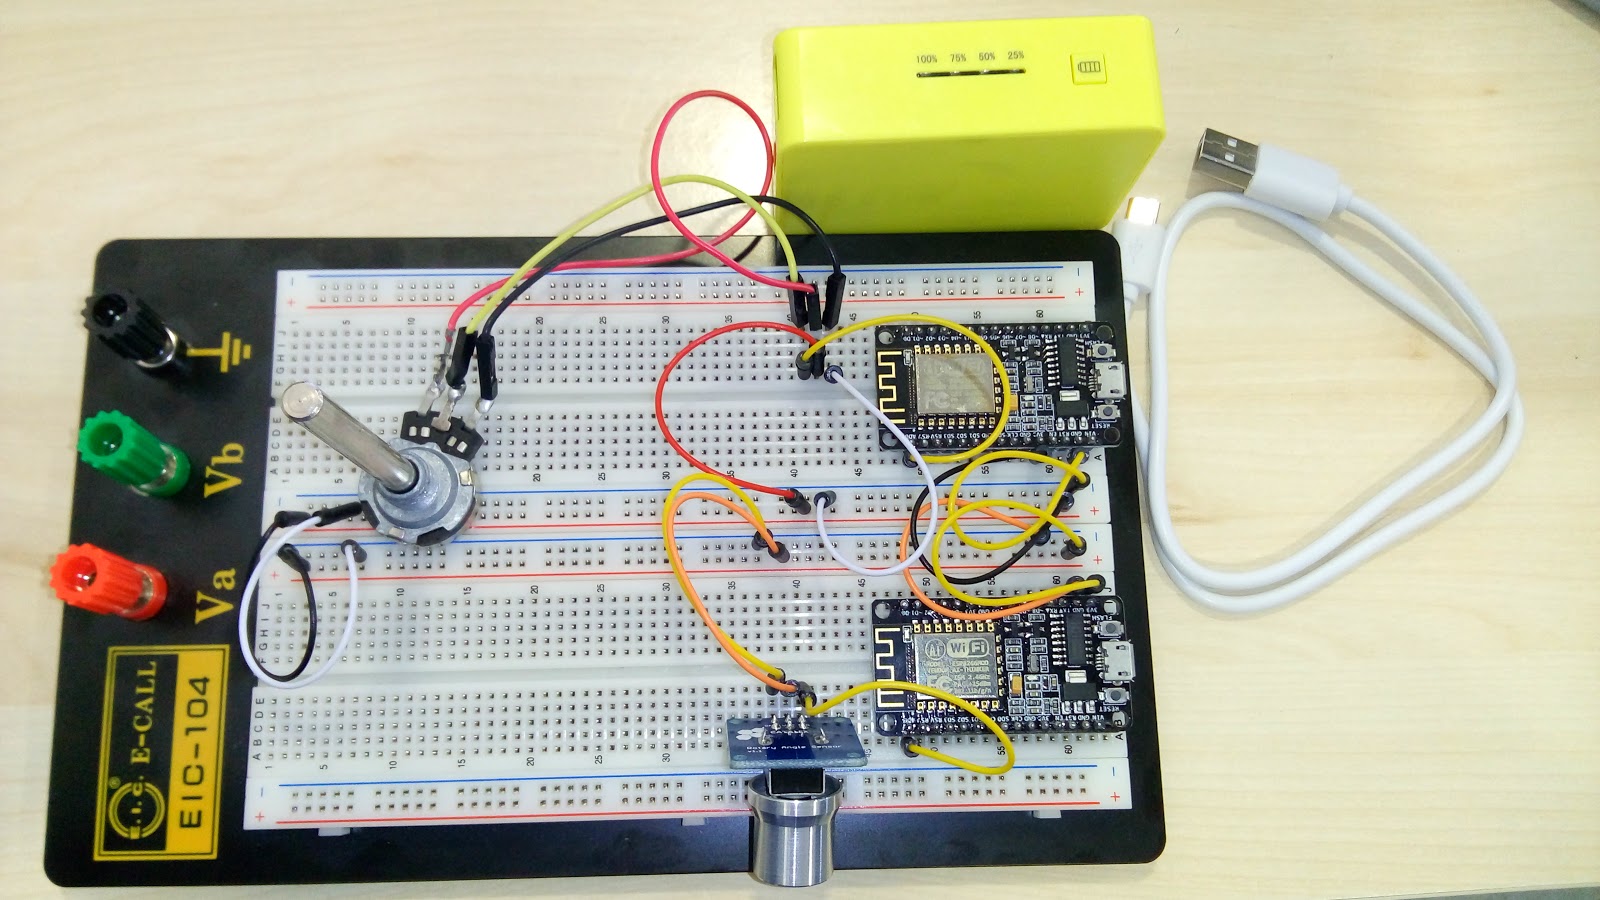
Using two ESP8266s, each with a potentiometer on the analog input, UDP packets are sent to the Qt application (backend), which interprets them and communicates with the frontend (QML) to display the information using the needle, as shown in the following image:
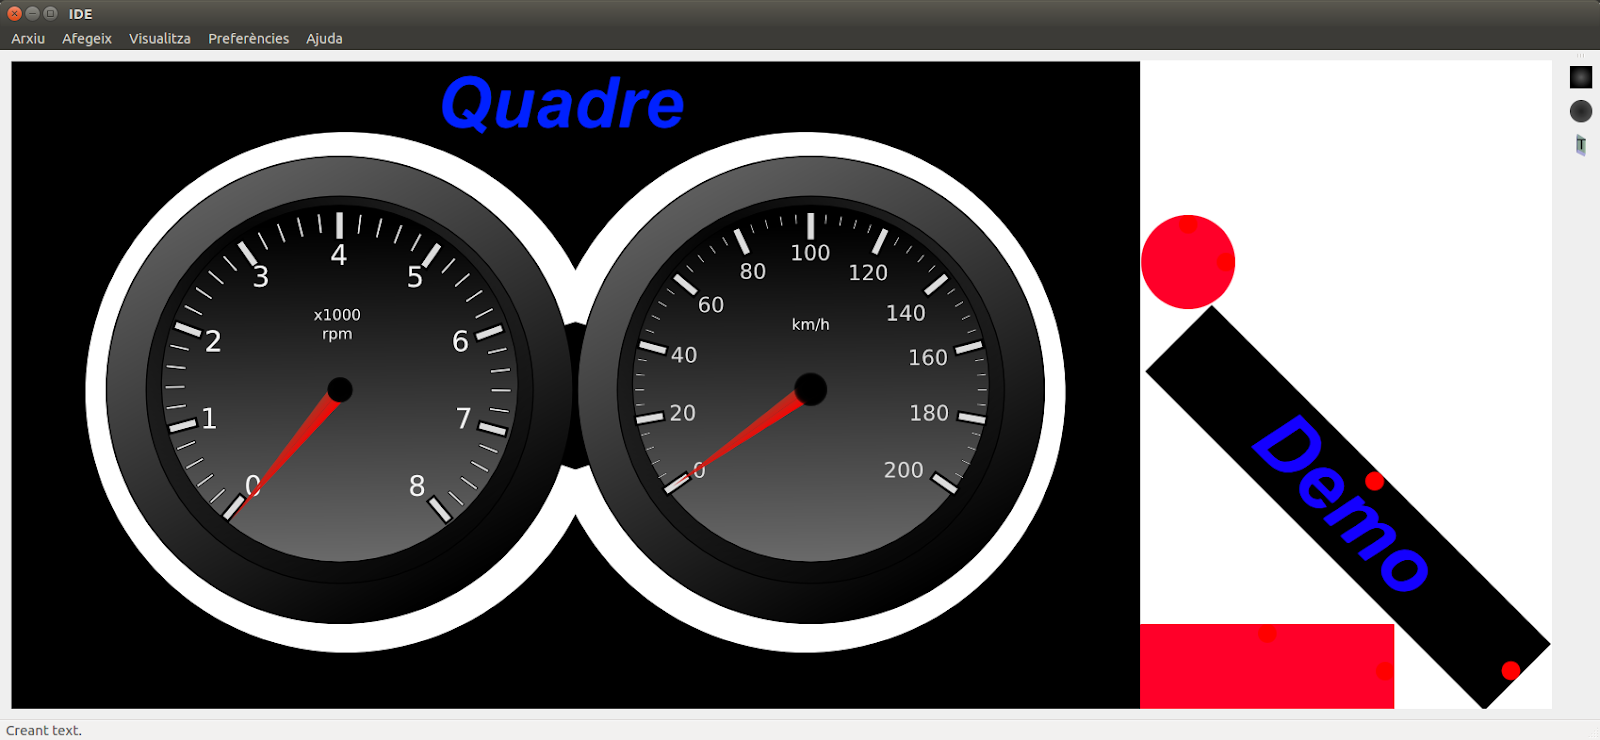
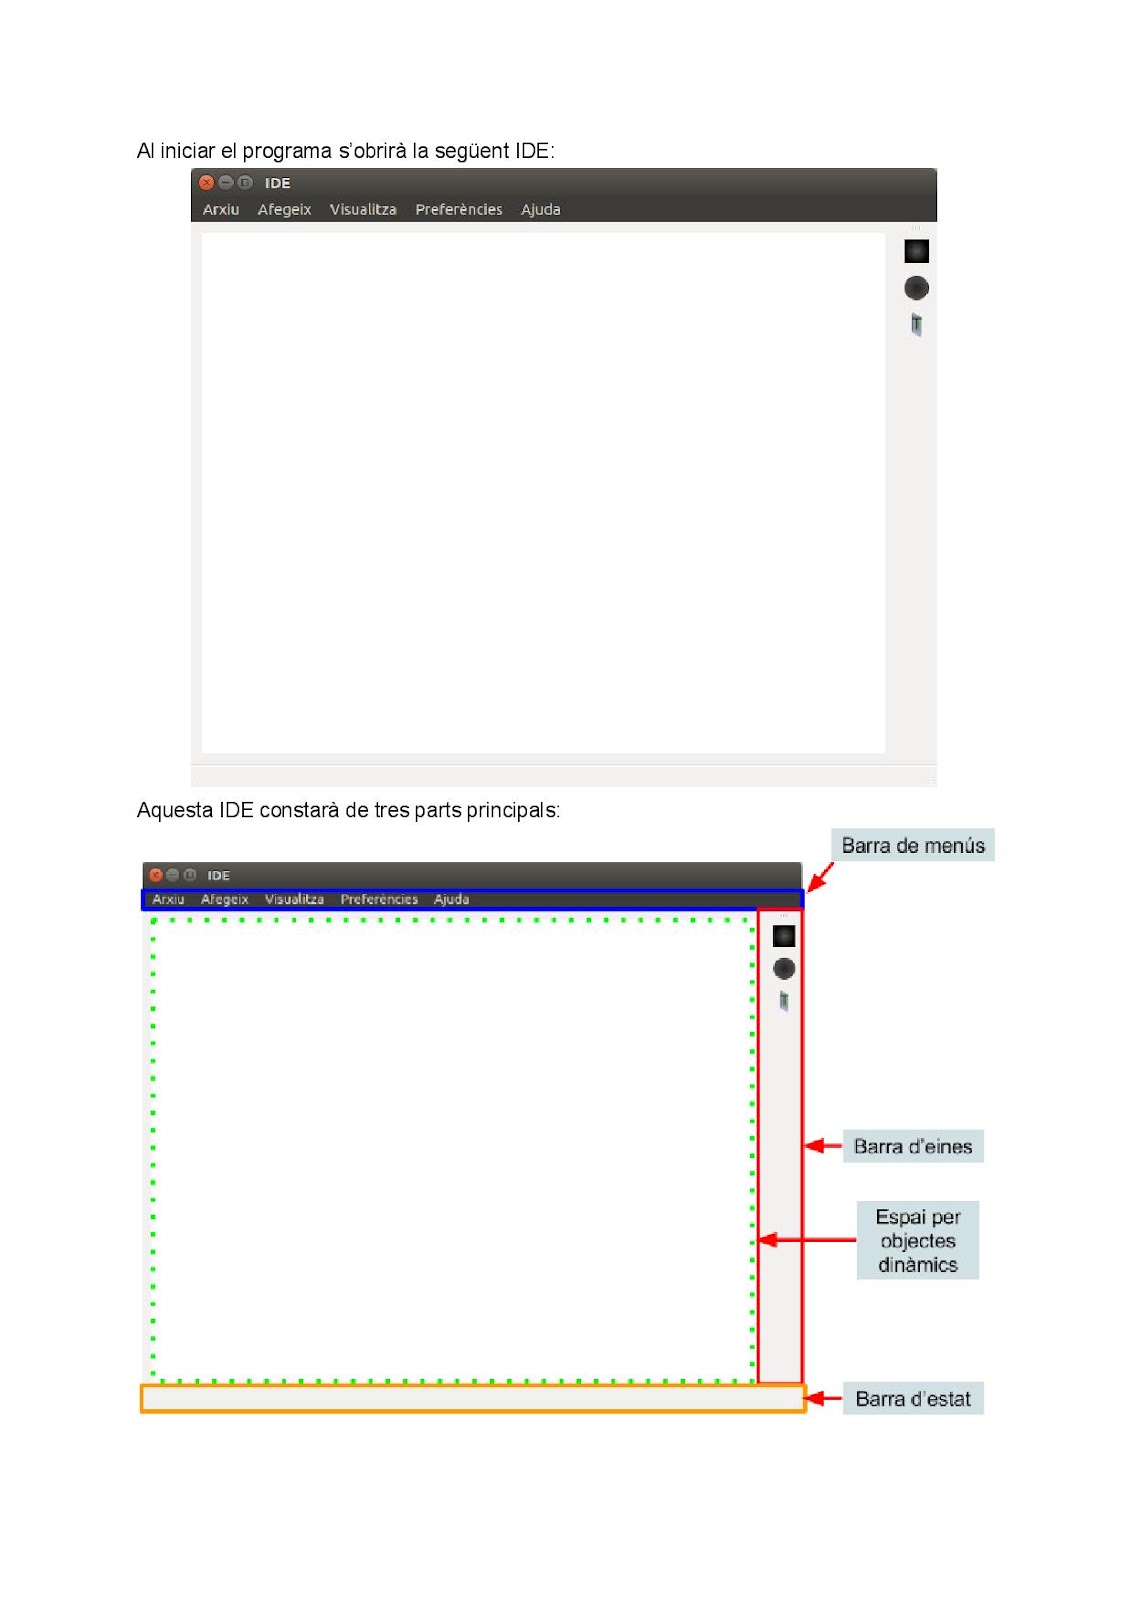
Using the IDE, we can see how the Qt code interacts with QML:
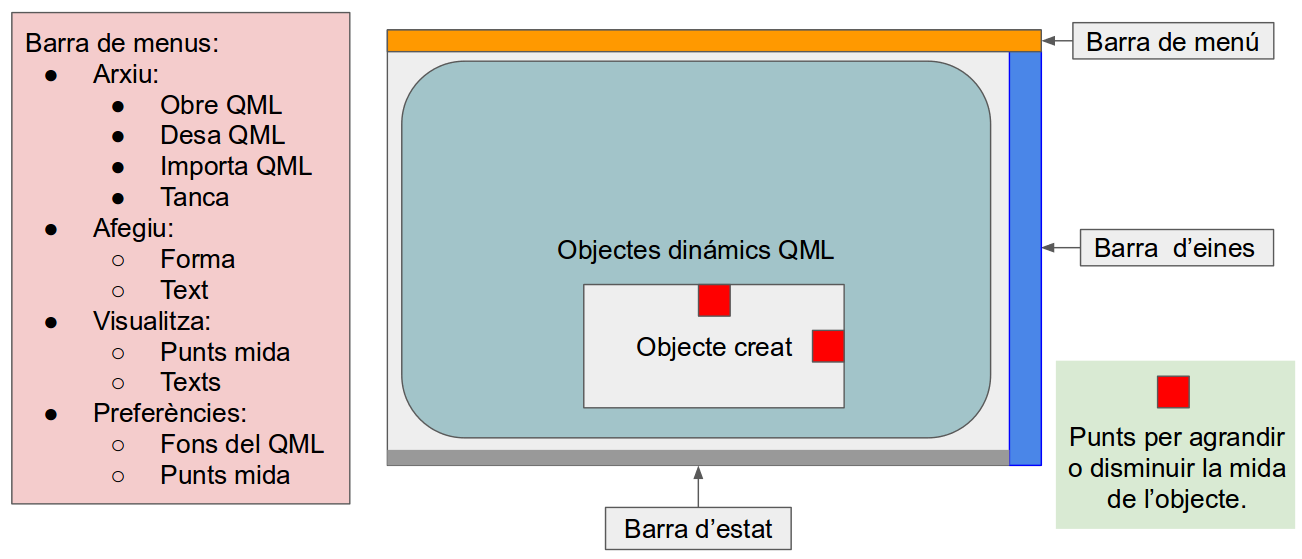
User interface definition
Development
First, the design prototypes for the graphical interface shown above were defined.
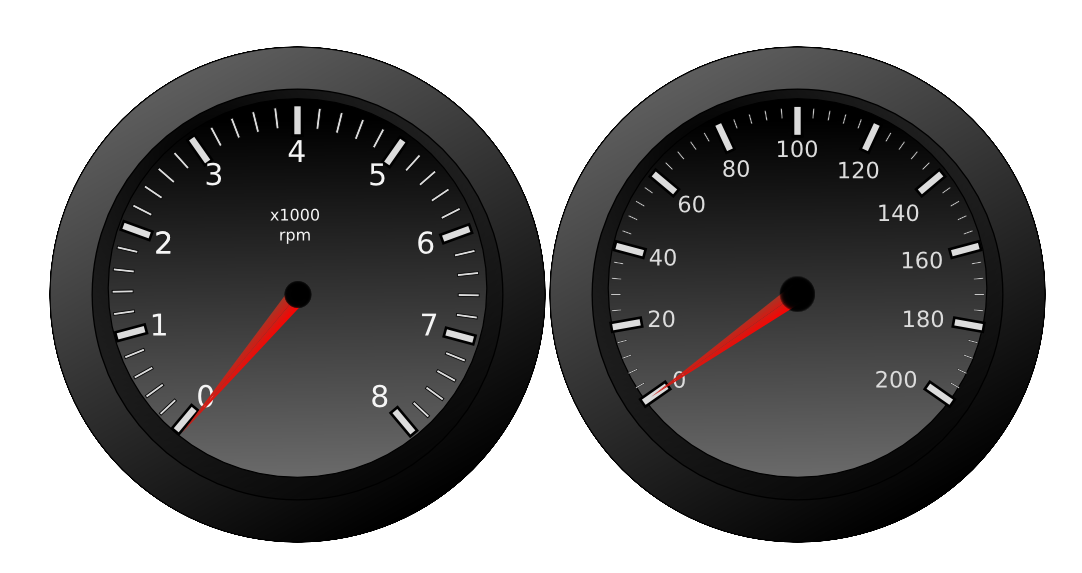
This was the initial idea for the design. Once completed, the possibilities of QML were evaluated to build it directly with it, but the appearance needed improvement. Therefore, a design for the individual parts was made using Inkscape, which you can consult at this link.
These were integrated into the QML code and Qt, which was responsible for receiving the data from the ESP8266, as explained in the system definition.
Here we can see an image of the actual setup:
<iframe width="320" height="266" data-thumbnail-src="https://i.ytimg.com/vi/dUTnNmLkELs/0.jpg" src="https://www.youtube.com/embed/dUTnNmLkELs?feature=player_embedded" frameborder="0" allowfullscreen></iframe>
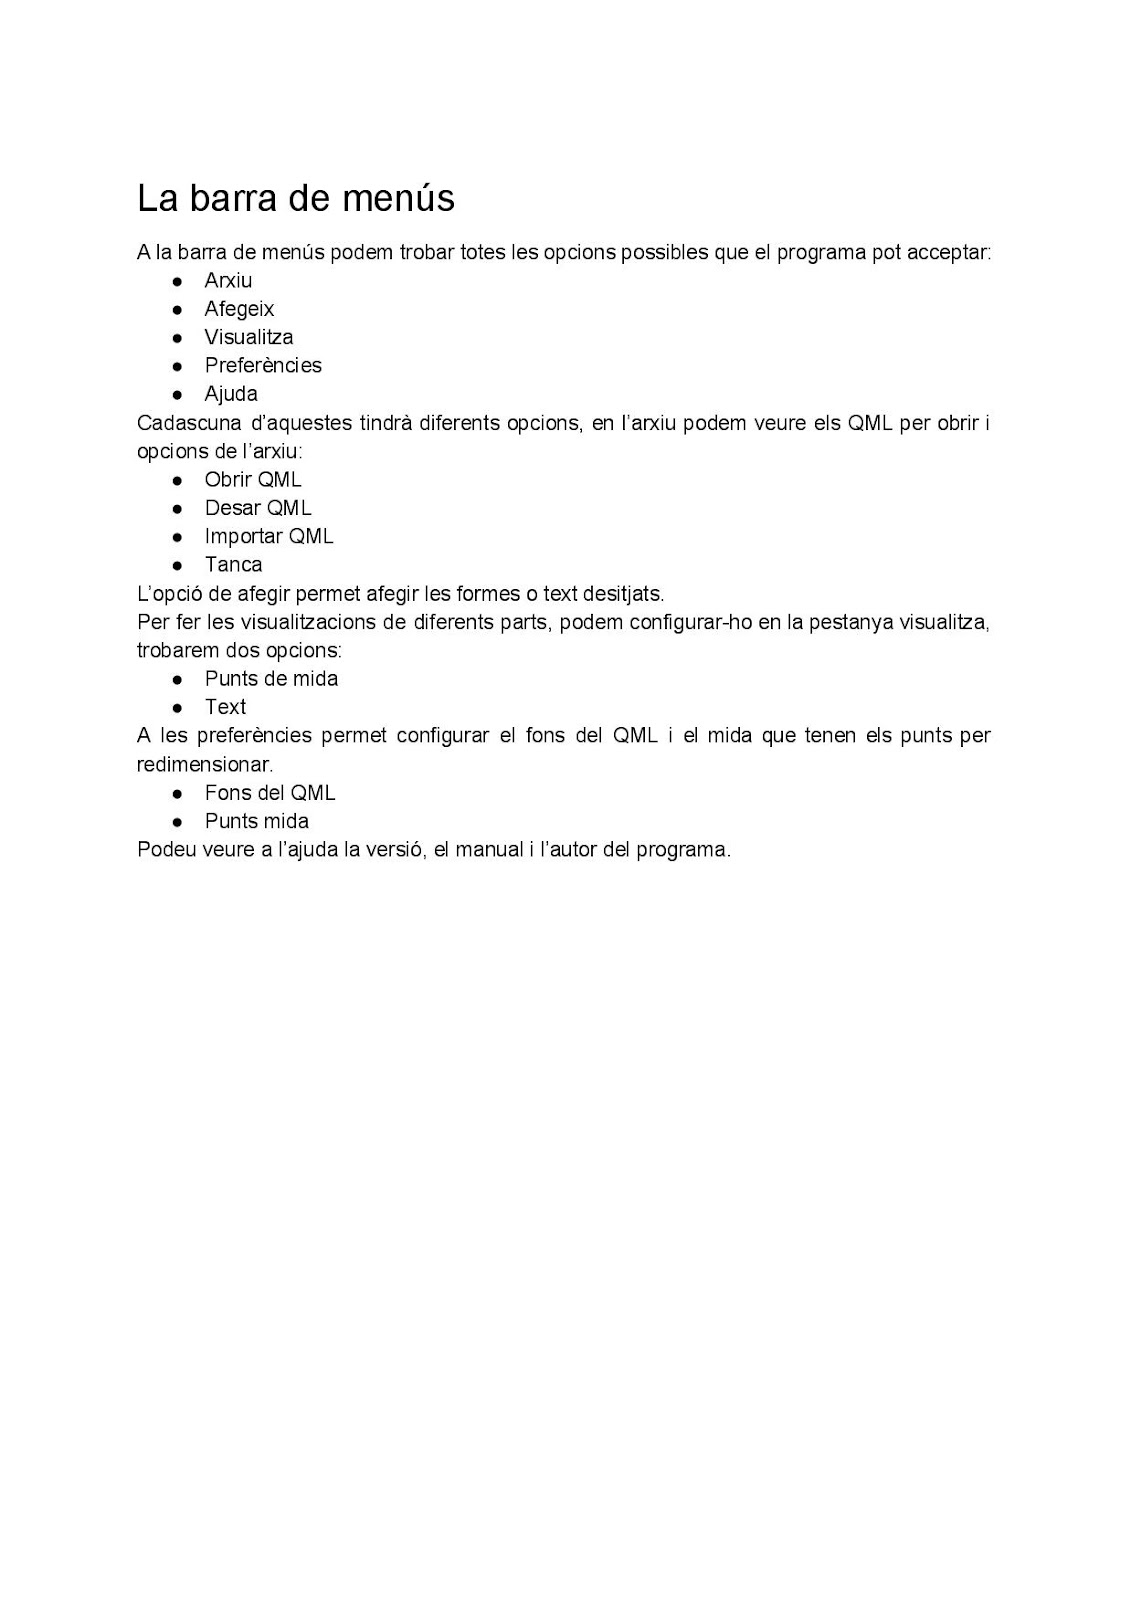
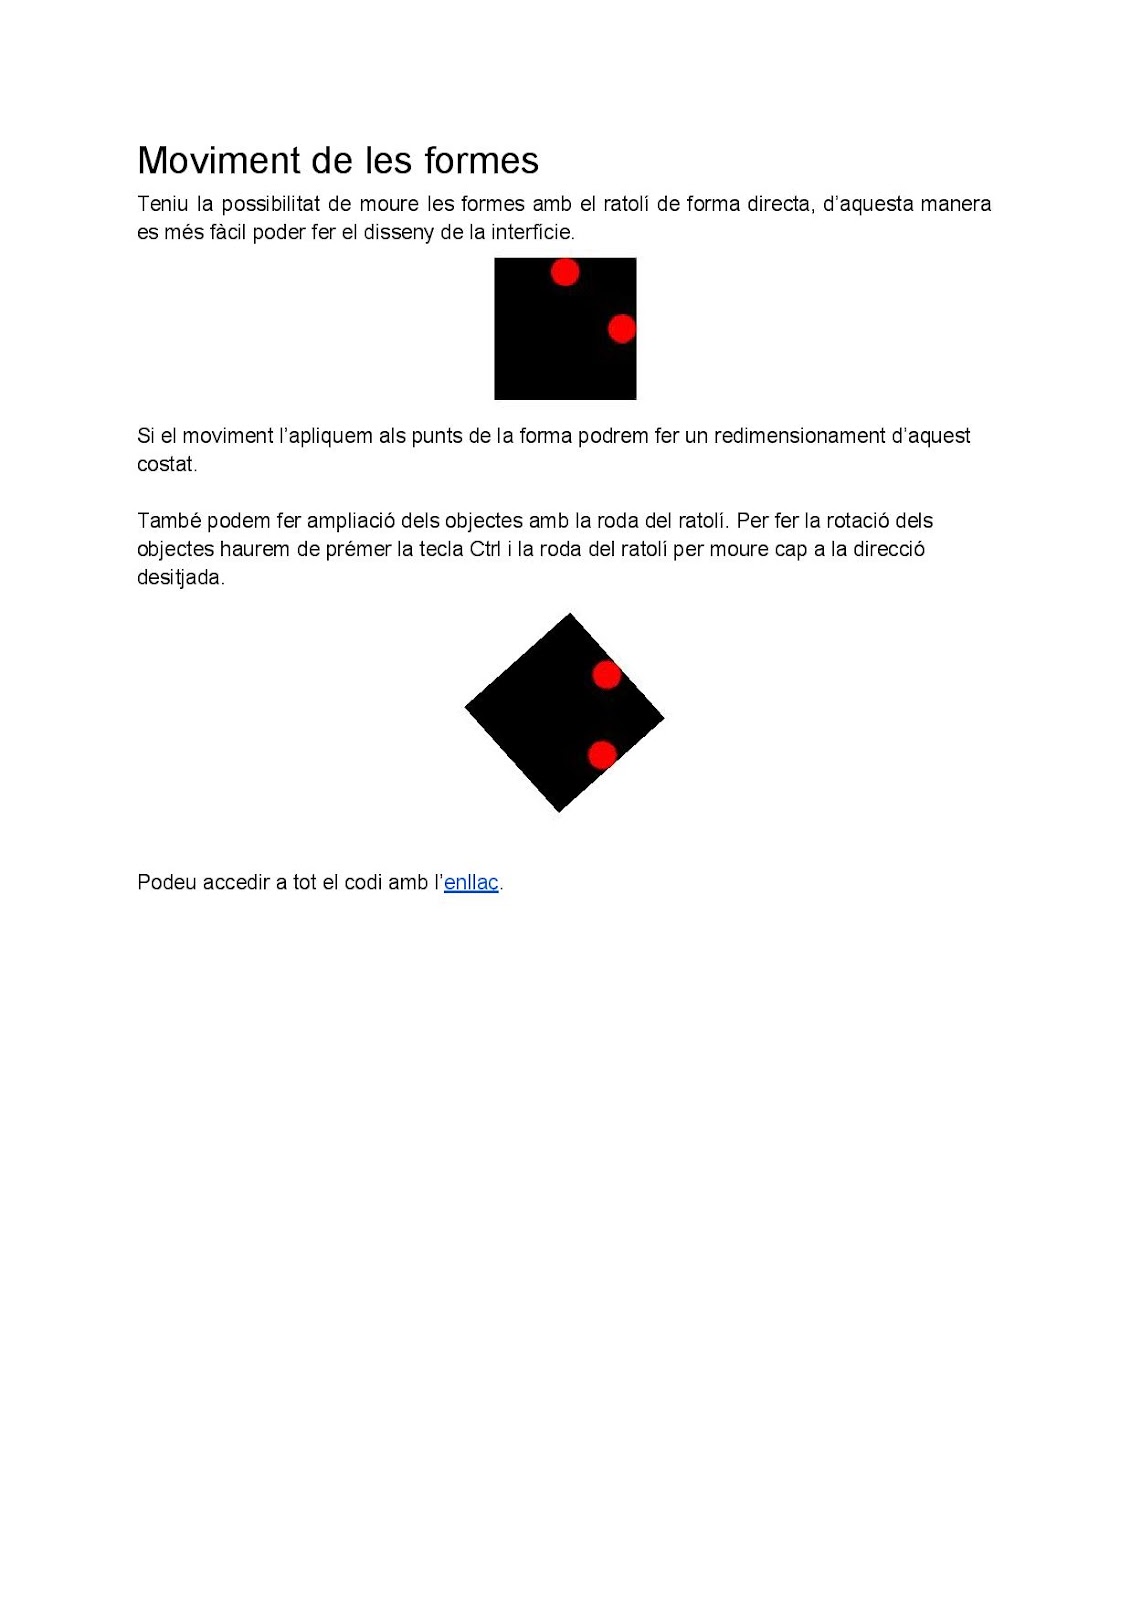
Afterwards, the different views available to the user were developed in order to check relevant information, create shapes, add text... as can be seen in the user interface.
<iframe width="320" height="266" data-thumbnail-src="https://i.ytimg.com/vi/YRJnz7uyTLw/0.jpg" src="https://www.youtube.com/embed/YRJnz7uyTLw?feature=player_embedded" frameborder="0" allowfullscreen></iframe>
Manuals
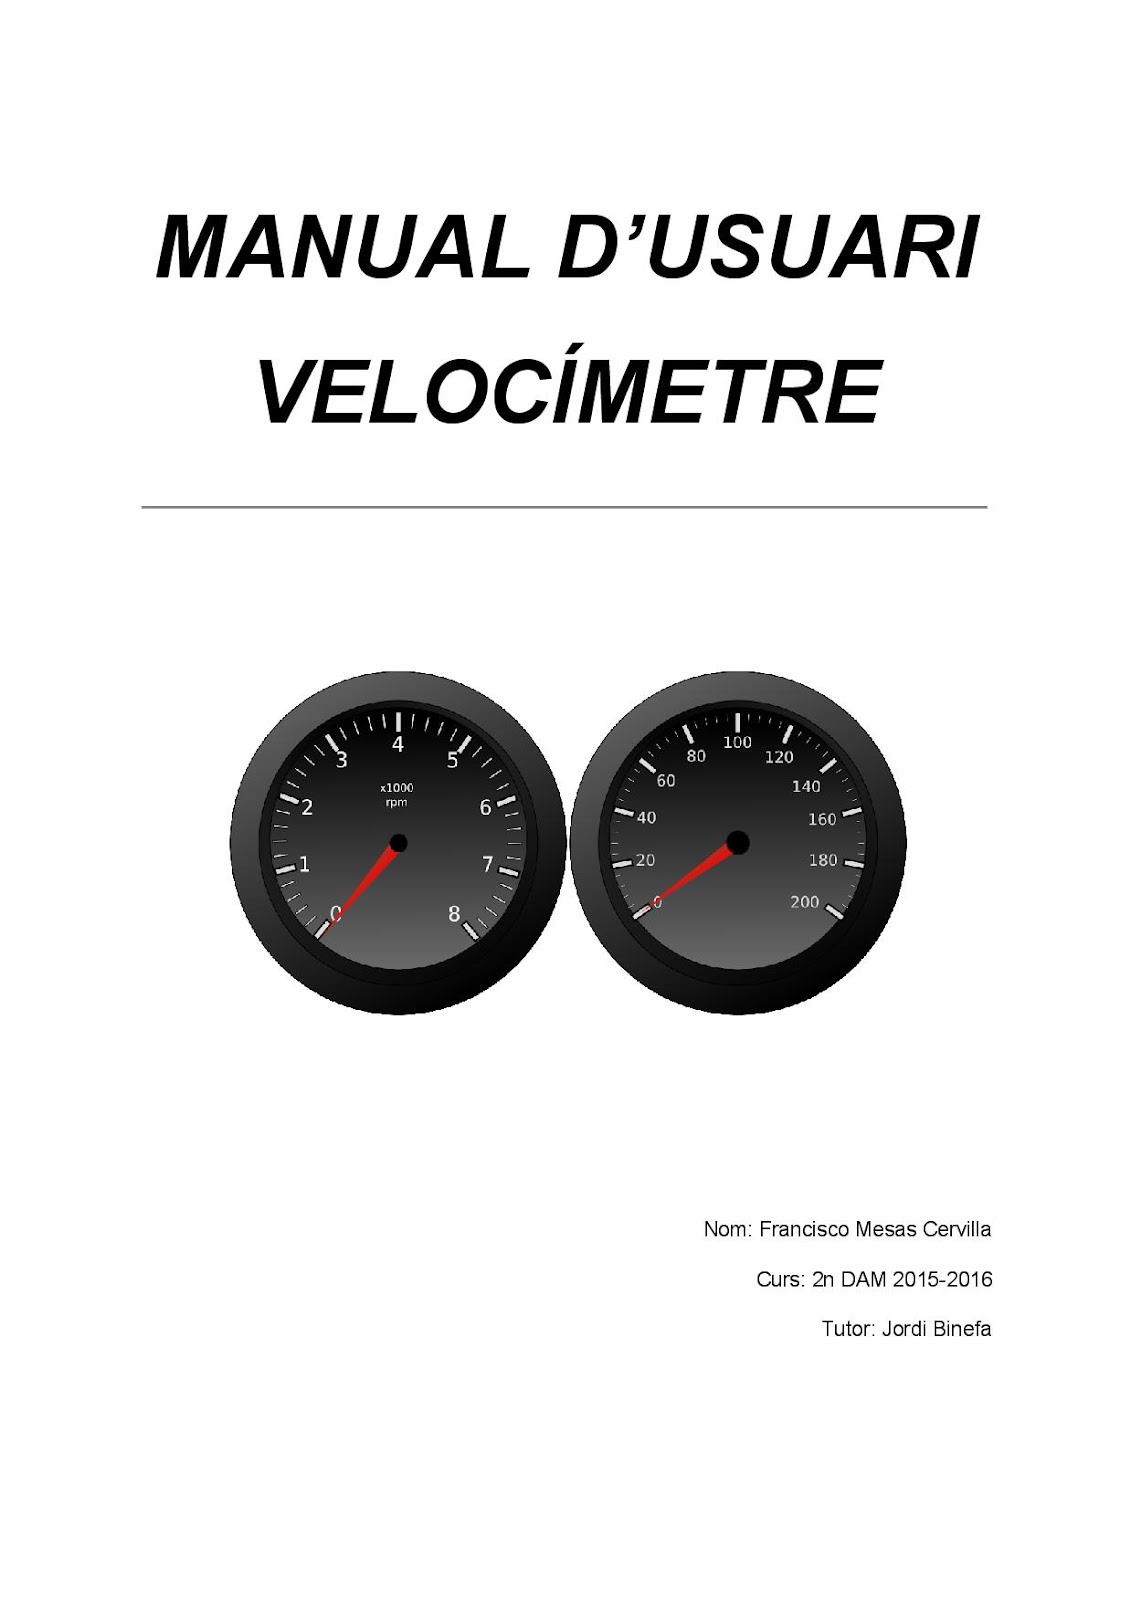
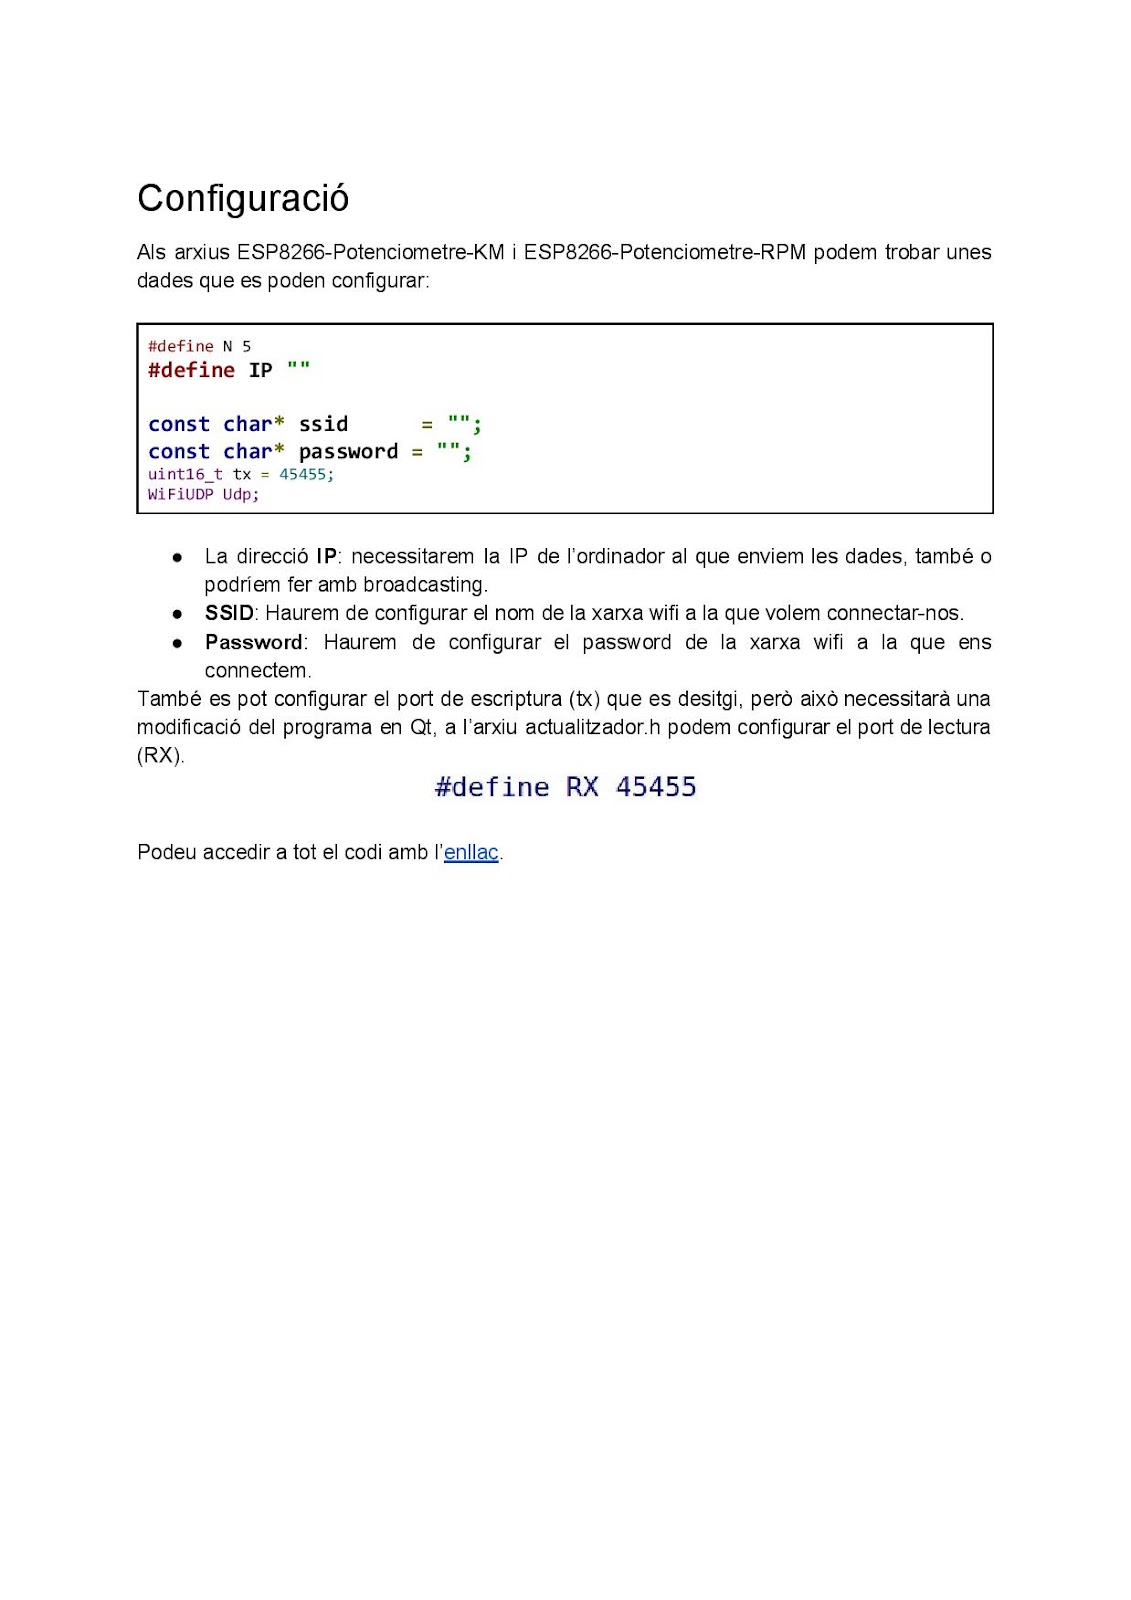
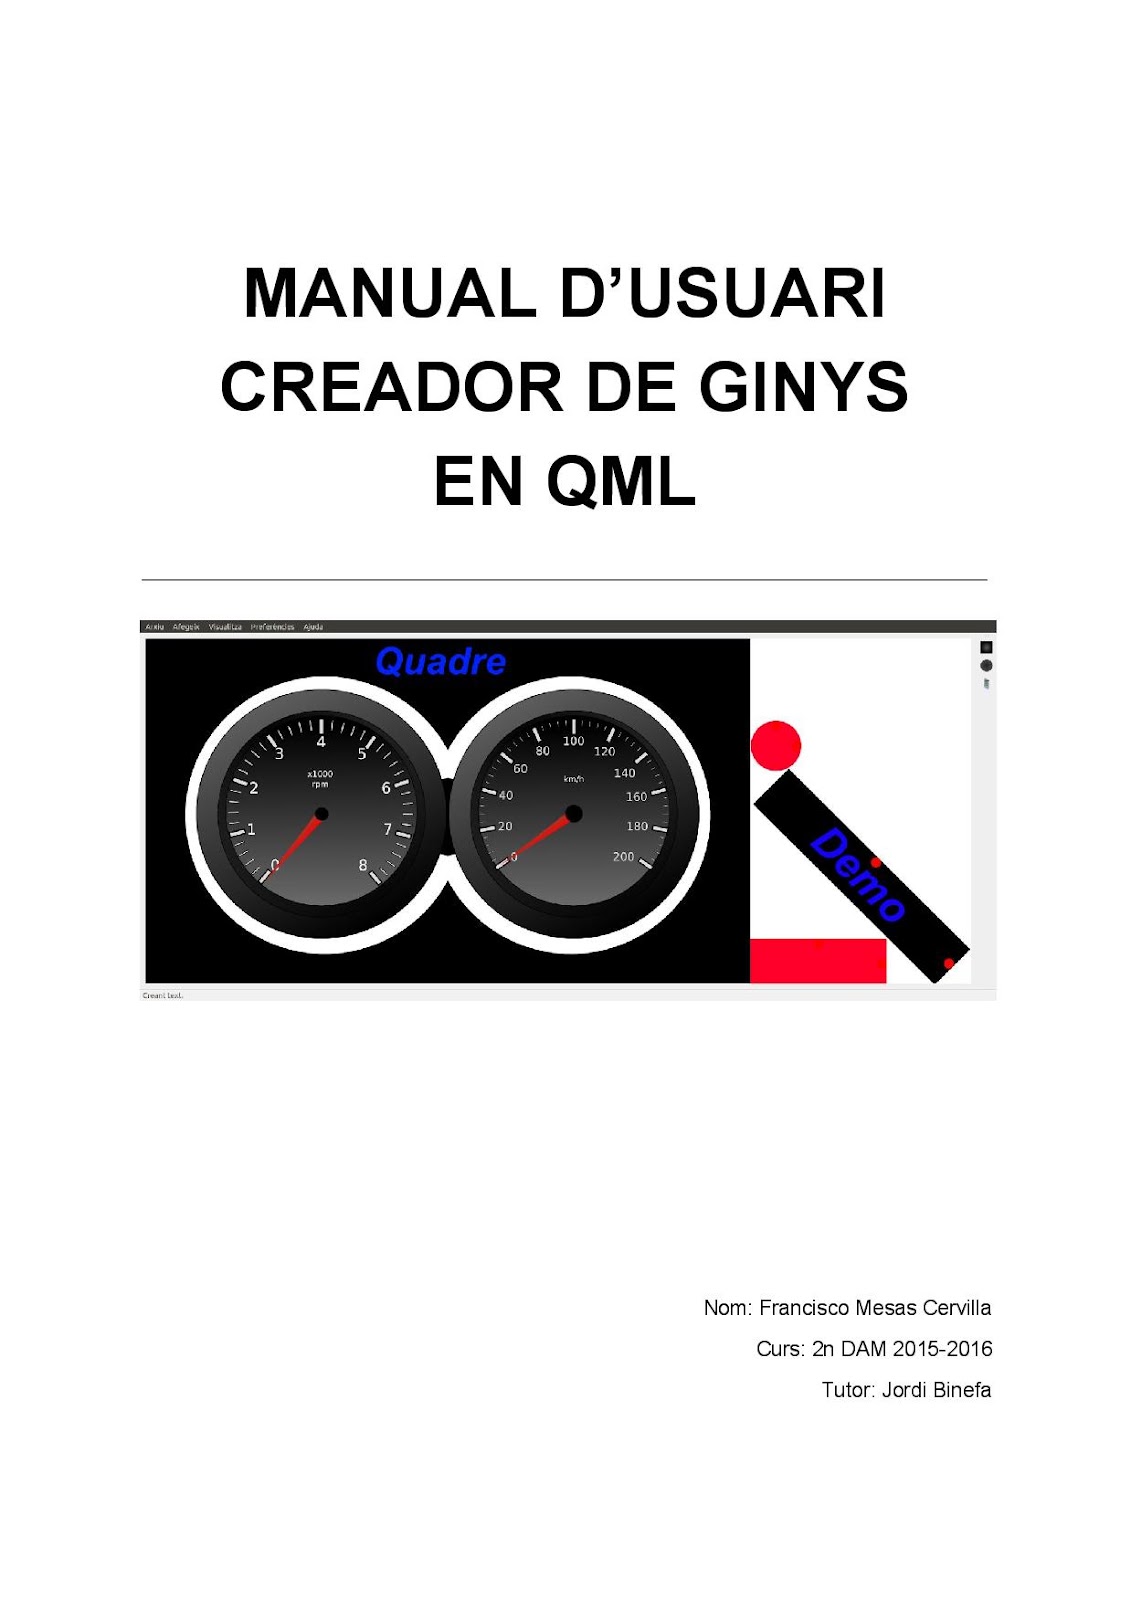
The manuals can be downloaded at the following links:
<figure class="gdoc-embed">
<iframe src="https://docs.google.com/document/d/1AiqNJJR4604VRdAKsuvharkoCienYOn9OOO7It0Hugw/preview" title="Velocímetre" loading="lazy" allowfullscreen></iframe>
<figcaption><a href="https://docs.google.com/document/d/1AiqNJJR4604VRdAKsuvharkoCienYOn9OOO7It0Hugw/edit?usp=sharing" target="_blank" rel="noopener noreferrer">Velocímetre — abrir en Google</a></figcaption>
</figure>
.
|
|
|
 |  |
|---|---|
 |  |